
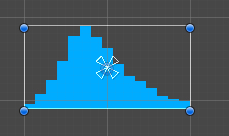
棒グラフのスクリプトメモです。
コードC#
using UnityEngine;
using UnityEngine.UI;
[RequireComponent(typeof(CanvasRenderer))]
[ExecuteInEditMode]
public class BarGraph : Graphic
{
    public float[] data;
    float graphWidth;
    float graphHeight;
    float barWidth;
    float maxDataValue;
    protected override void OnPopulateMesh(VertexHelper vh)
    {
        vh.Clear();
        if (data == null || data.Length == 0) return;
        graphWidth = rectTransform.rect.width;
        graphHeight = rectTransform.rect.height;
        barWidth = graphWidth / data.Length;
        maxDataValue = Mathf.Max(data);
        for (int i = 0; i < data.Length; i++)
        {
            float barHeight = (data[i] / maxDataValue) * graphHeight;
            UIVertex[] quad = new UIVertex[4];
            quad[0].position = new Vector3(i * barWidth, 0);
            quad[1].position = new Vector3(i * barWidth + barWidth, 0);
            quad[2].position = new Vector3(i * barWidth + barWidth, barHeight);
            quad[3].position = new Vector3(i * barWidth, barHeight);
            quad[0].color = color;
            quad[1].color = color;
            quad[2].color = color;
            quad[3].color = color;
            vh.AddUIVertexQuad(quad);
        }
    }
}
使い方
キャンバス内に空のオブジェクトを作成する
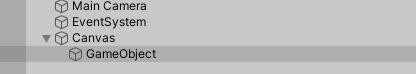
オブジェクトにBarGraphスクリプトを貼り付ける

完成

任意:pivotの値を0,0にする
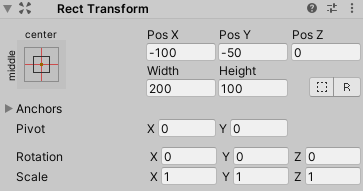
基準の位置はスクリプトを書き直しても変更できます。


共有コメント 共有されるコメント欄です。